How to use Stratos
Everything you need to know about researching markets, building strategies, testing the edge, and operating with Orbit AI.
Limits
- Stratos is not a broker and not an advisor. It does not give personalized buy, sell, or hold recommendations.
- Paper trading uses virtual capital. Alerts email you once, then turn off. They do not submit orders. Live brokerage execution is coming. It is not available today.
- Options, futures, and forex are out.
- A backtest is a historical simulation, not a record of live trading and not a promise of future results.
The full map of what ships today is on Product facts. Hypothetical-performance limits are in the Terms of Service.
What is Stratos?
Stratos is an AI-powered market intelligence and strategy engineering platform. Research live markets, turn trading ideas into systematic strategies, and test them with ATLAS without writing production code. Describe what you want to Orbit, refine it in the visual builder, and run it against years of market data in seconds.
Analyze
Ask Orbit about any market, sector, or asset. Get real-time analysis with cited sources — like having a quant analyst on demand.
Build & Test
Describe a strategy in plain English or configure it visually. ATLAS runs it against historical data with stress tests and professional-grade metrics.
Iterate
Use the results dashboard and Orbit's analysis to understand what worked, what didn't, and how to sharpen your edge.
The live research loop is here. Stratos now includes real-time market data, live price streaming, watchlists, paper trading, and live alerts. Paper trading is simulated. Stratos does not place real-money brokerage orders.
Home — Market Intelligence
The Home page (/home) is your daily Market Intelligence terminal — Markets pulse and briefing in the center, Watchlist and Paper Portfolio on the side tabs, with the Orbit siderail ready for follow-up questions.

Markets Tab
The default tab. Shows the shared Market Intelligence Brief, live index cards with intraday sparklines, and sector performance so you can read the tape before you build.
Market Intelligence Brief
Shared Orbit-generated market summary covering regime, drivers, and what to watch next. Dive Deeper opens a richer brief when you want more depth.
Market Pulse
Live index levels (S&P, Russell, Dow, VIX, and more) with sparklines so you can scan direction at a glance.
Sector Performance
Horizontal bars showing relative sector strength across the trading day — rotation, leaders, and laggards.
Orbit Siderail
Ask about the tape, sector rotation, or a setup without leaving Home. Use Continue in chat for longer research threads.
Watchlist Tab
Track your assets with live prices and day change. Live prices update in real-time via WebSocket when markets are open.
- Click + Add Ticker to search and add any stock, ETF, or index.
- Click any ticker row to open its full Markets detail page.
Portfolio Tab
Your paper trading command center. This is where you monitor simulated capital, open exposure, manual paper orders, and recent paper activity.
Paper Equity
Cash plus open paper exposure, updated from the Stratos paper ledger.
Unrealized P&L
Live profit and loss across open paper positions.
Manual Orders
Submit market, limit, stop, and stop-limit paper orders directly.
Recent Orders
Review open, filled, canceled, and rejected paper activity.
Live data connectivity
Prices stream over a WebSocket connection to the Stratos backend, which proxies Alpaca real-time data. US equity prices update during regular market hours; crypto streams where provider coverage is available. Outside live sessions, Stratos shows the latest available price snapshot. If the stream is reconnecting, prices show as connecting until the feed is healthy again.
Markets Deep-Dive
Navigate to /markets/[TICKER] (e.g. /markets/AAPL) for a full research view on any asset. You can reach it by clicking any ticker in the Watchlist, clicking an index card on the Markets tab, or typing a ticker in the global search.
Interactive Chart
Price chart with volume context and research overlays. Select timeframes from short-term views to long history.
Key Stats
Market cap, P/E, EPS, 52-week range, avg volume, beta, and dividend yield.
Research Tabs
News, Technicals, Fundamentals, and Sentiment in one research surface, with Orbit ready for follow-up questions.
Strategy Banner
If you have an open paper position on this ticker, Manage opens Home → Portfolio. Arm paper from Strategies → Paper after a saved strategy.
Build Strategy →
Header CTA that pre-fills the ticker in the Strategy Builder.
Build, then arm
Header CTA that opens Builder with this ticker so you can draft, save, then arm paper. There is no separate paper-trading Builder mode.
Research tabs: News, Technicals, Fundamentals, and Sentiment combine live data, fundamental APIs, deterministic reports, and Orbit synthesis. Use "Discuss with Orbit →" to open a chat with the research context already loaded.
The Strategy Builder
The Strategy Builder at /builder is where you configure every aspect of your strategy. It has six main areas.
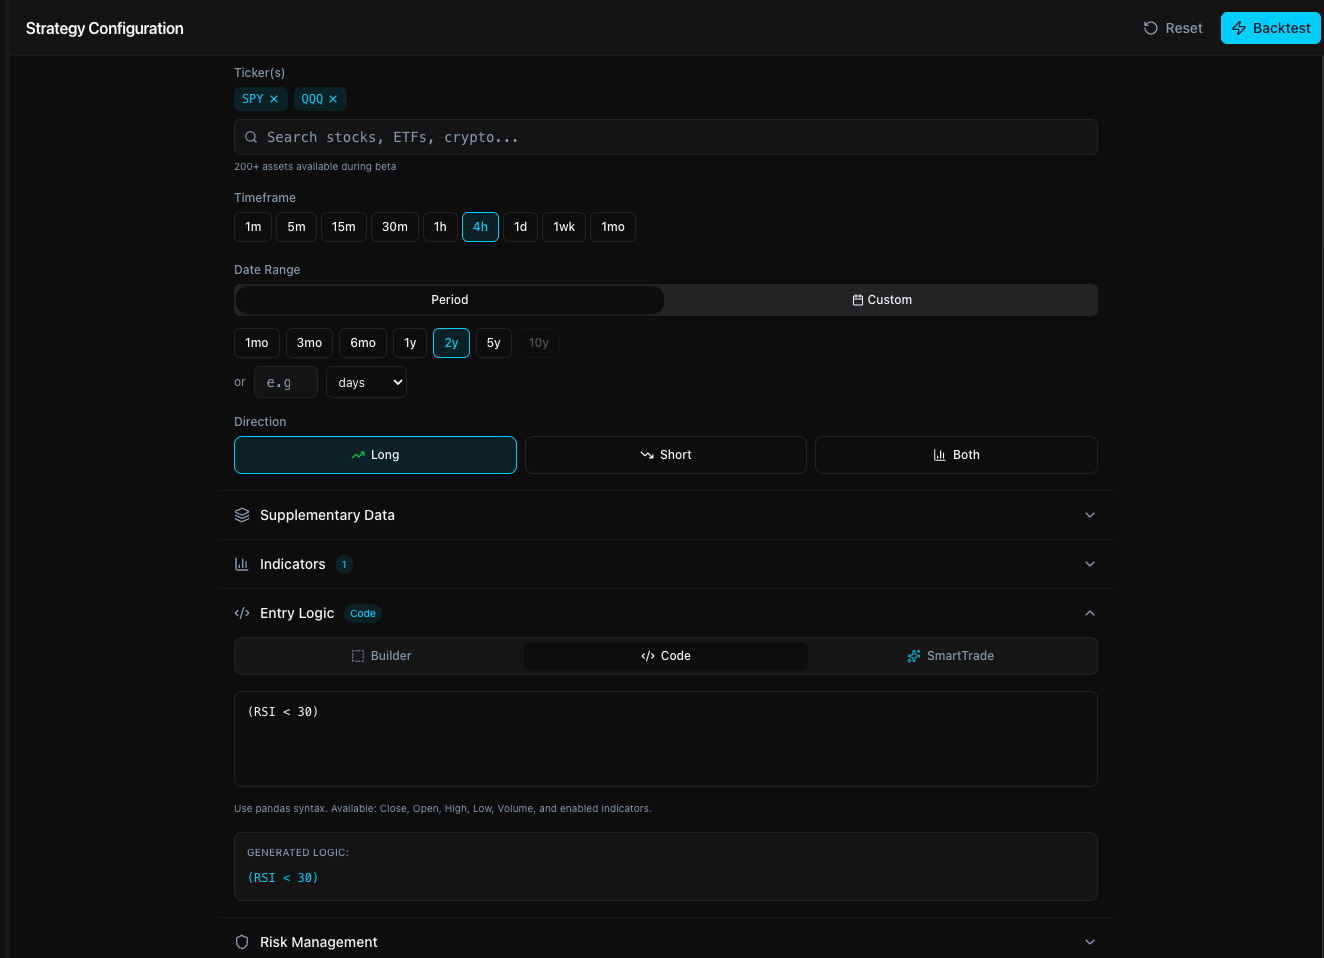
1. Asset Universe
Select one or more tickers to trade. You can also add supplementary tickers (e.g., SPY, QQQ, VXX, TLT) whose data feeds into your entry logic — useful for macro-conditional strategies without trading those assets directly.
Stratos supports US equities, ETFs, leveraged ETFs, and major crypto pairs during beta. Search by ticker from the Builder or command palette; unsupported symbols are rejected before they waste a backtest run.
2. Timeframe & Period
Choose the bar resolution and the historical window to test over.
Intraday bars use Alpaca minute data. Daily and above use adjusted OHLCV.
Or pick exact start/end dates for a custom date range.
3. Indicators
Enable the technical indicators you want available in your entry and exit logic. Each has configurable parameters — once enabled, their computed values can be referenced directly in conditions.
Relative Strength Index
Exponential Moving Average
Simple Moving Average
MACD + Signal Line
Upper, Middle, Lower Bands
Average True Range
Average Directional Index
%K and %D oscillator
Volume-Weighted Avg Price
Price momentum
Commodity Channel Index
Williams Percent Range
Automatic warmup period
ATLAS automatically determines the longest indicator period you have configured and removes that many bars from the start of the backtest. For example, if you enable SMA(200), the first 200 bars are excluded from signal generation — preventing false signals from incomplete indicator values. Your effective backtest window is slightly shorter than configured when using long-period indicators.
4. Strategy Mode
Choose whether your strategy trades Long, Short, or both directions. This determines how many sides you need to configure — Long and Short have completely independent entry logic and risk management.
Long Only
Only takes buy positions. Standard for equity strategies.
Short Only
Only takes short positions. For bearish or hedging strategies.
Long + Short
Takes both directions. Configure entry logic and risk for each side independently.
5. Entry Logic — Three Modes
Stratos supports three distinct ways to define when to enter a trade. In Long + Short mode, each side gets its own independent entry logic.
Visual condition builder. Add rows of conditions joined by AND / OR logic. Each condition has a left operand, an operator, and a right operand. Supports modifiers like previous bar, rolling average, and percent change.
Quick presets: Momentum Breakout, RSI Oversold, 3% Gap Up, Trend Following.
Write entry logic as a Python-style boolean expression. Reference any enabled indicator by name. Supports all standard operators and parenthetical grouping.
(RSI_14 < 30) & (Close > EMA_50) & (MACD > MACD_Signal)Use an Alpha Model as your entry signal. Select a SmartTrade model, then run a backtest so ATLAS trains and evaluates it on that strategy's data.
6. Risk Management
Risk rules are enforced at the per-trade level by the ATLAS engine, applied independently per side (Long / Short).
- Percentage — Fixed % below entry price (e.g., 2%)
- ATR-based — Multiple of Average True Range (e.g., 2x ATR)
- Indicator — Exit when price crosses a level (e.g., below EMA_50)
- Trailing Stop — Activates after a gain threshold, then trails by a set %
- Single — Exit 100% of position at a target % gain
- Scaled / Partial — Exit in tranches (e.g., 50% at 5%, rest at 10%)
- Indicator — Exit when price crosses a technical level
Running a Backtest
Once your strategy is configured, click Run Backtest. The ATLAS engine processes your strategy as a background job — you'll see a live status overlay while it runs.
Data Fetch
ATLAS pulls historical OHLCV bars from Alpaca for all selected tickers across your chosen period and timeframe.
Indicator Calculation
All enabled indicators are computed on the full dataset. The warmup period (longest indicator period) is automatically removed from the signal window.
Signal Generation
Your entry logic is evaluated bar-by-bar. Executions fill at the open of the next bar to eliminate look-ahead bias.
Risk Management
Take-profit and stop-loss levels are checked on every subsequent bar. Slippage and commission are included when configured.
Monte Carlo Analysis
The engine stress-tests the result by resampling trade outcomes, helping you separate a resilient edge from a lucky sequence.
Results
You're redirected to the results dashboard with full metrics, equity curve, trade log, and Monte Carlo distribution.
No look-ahead bias. All trades fill at Open[T+1]— the opening price of the bar after the signal. Your strategy never uses data it couldn't have known at signal time.
Understanding Your Results
The results page gives you the quant cockpit: equity curve first, benchmark comparison beside it, then color-coded performance, risk, and trade-quality metrics. Green means the historical evidence is strong, amber means investigate, red means the system needs work before it deserves monitoring.
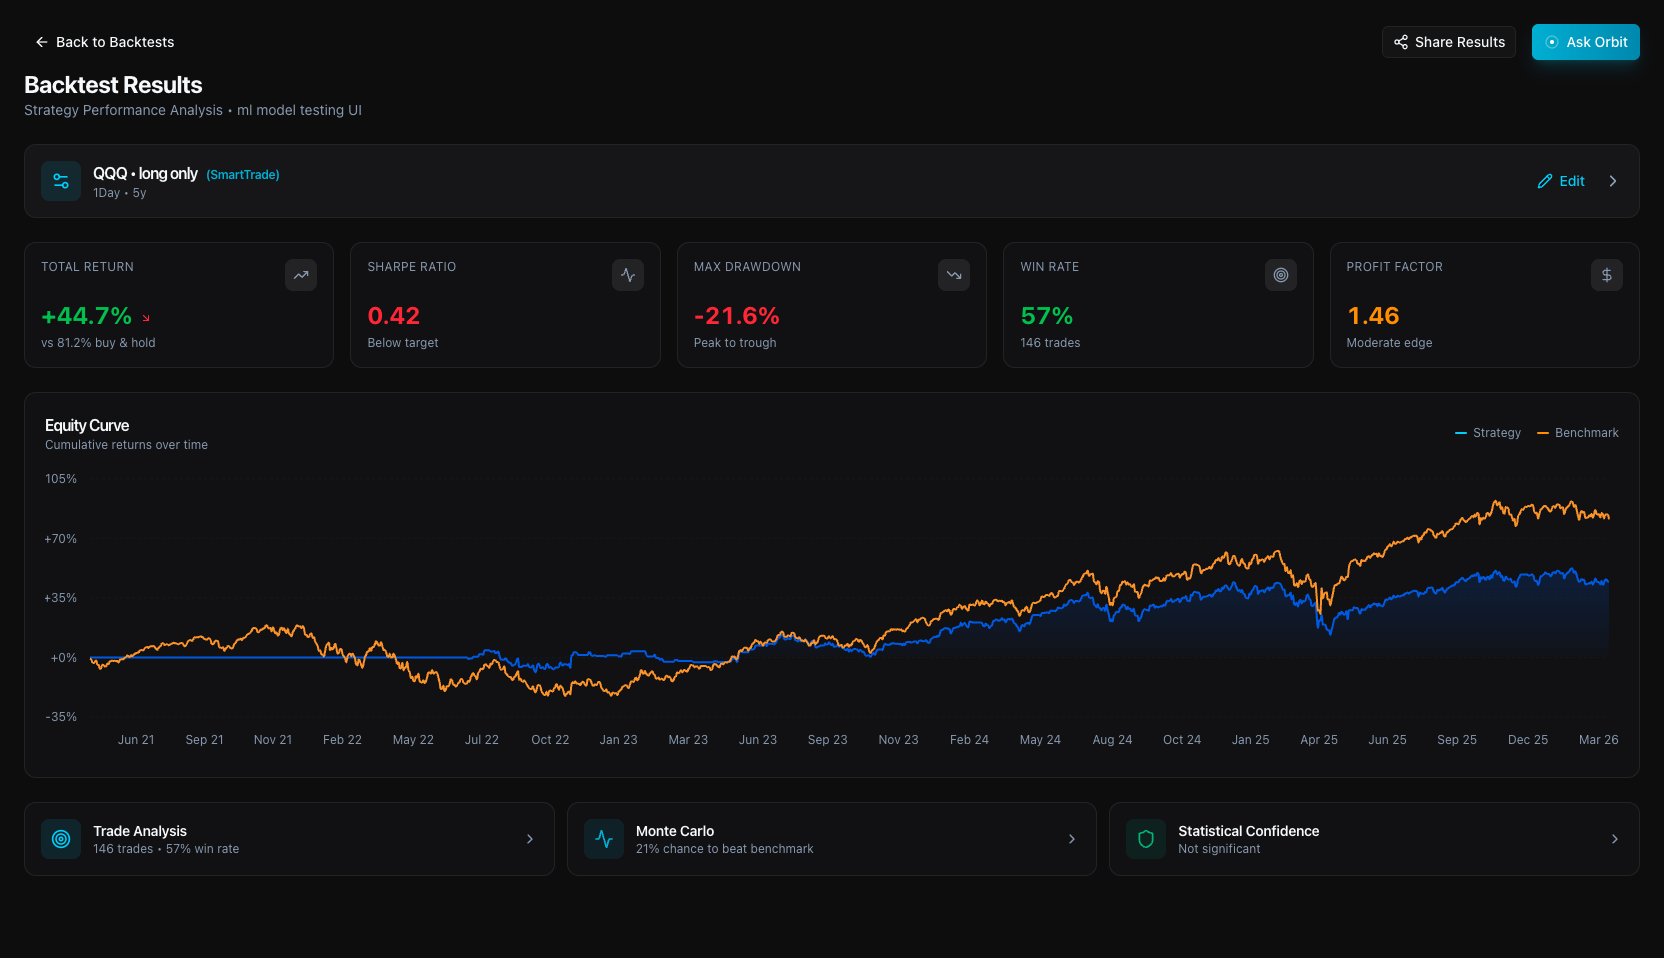
Equity Curve
The first thing you see is the strategy's portfolio value over time plotted against the configured benchmark — buy-and-hold, a comparison ticker, or no overlay if you chose None. The gap between the two lines is the historical outperformance story. If active trading trails that comparison through a full market cycle, the system needs a stronger reason to exist.
Primary Metrics
Total Return
Cumulative percentage gain or loss over the entire backtest period, after slippage and commissions. Shown alongside the selected benchmark return when one is configured — buy-and-hold, a ticker, or hidden when Benchmark is None.
Sharpe Ratio
Annualized excess return divided by total return volatility. Tells you how much reward you get per unit of risk. A Sharpe below 0.5 means the strategy doesn't compensate for the volatility it introduces.
Max Drawdown
The largest peak-to-trough decline in portfolio value across the entire backtest. This is the worst-case capital loss you would have experienced — a critical input for position sizing and risk tolerance.
Win Rate
Percentage of trades that closed at a profit. Importantly, a high win rate alone does not make a strategy good — a 40% win rate can still be powerful if winners are significantly larger than losers. Pair with Profit Factor.
Profit Factor
Gross profit from all winning trades divided by gross loss from all losing trades. A factor of 2.0 means you earned $2 for every $1 lost. Values below 1.0 indicate a net-losing strategy regardless of win rate.
Secondary Metrics
These metrics provide deeper insight into how the strategy manages downside risk and how efficiently it converts drawdown into return. They appear in a compact strip below the primary metrics.
Sortino Ratio
Like Sharpe, but only penalizes downside volatility — upward swings are not counted against the strategy. Better for strategies with asymmetric return profiles where large wins are common. Uses a 4.28% annualized risk-free rate.
Calmar Ratio
Annualized return divided by maximum drawdown. Unlike Recovery Factor, this uses the annualized return — so a 5-year strategy is compared on the same footing as a 1-year strategy. Higher means more return per unit of worst-case pain.
Recovery Factor
Total return divided by maximum drawdown — a simpler cousin of the Calmar ratio that uses raw total return instead of annualizing. A factor of 3.0 means the strategy gained 3x what it lost at its worst point. Best read alongside Calmar when comparing strategies of different lengths.
Expectancy
The average return per trade, weighted by win rate and loss rate. Formula: (win rate × avg win) + (loss rate × avg loss). Positive expectancy is the mathematical heartbeat of a strategy: the average trade is worth taking in the historical sample.
Monte Carlo Analysis
ATLAS resamples trade outcomes to stress-test the path. This answers the critical question: does the historical edge survive sequence risk, or was the headline return lucky?
Median Return
The 50th-percentile return across all simulations. A grounded center point for the historical outcome distribution.
5th Percentile
The worst-case return in 95% of simulations. A conservative lower bound on your downside.
95th Percentile
Best-case return in 95% of simulations. Shows upside potential under favorable trade sequencing.
Risk of Loss
Fraction of simulations that ended with a net loss. Lower is better.
Prob. Beat Benchmark
Percentage of simulations that outperformed the benchmark. Above 70% is a strong sign that the strategy is doing more than riding the same market exposure.
Return Std Dev
Volatility of simulated returns. Lower means results are more consistent across different trade sequences.
Trade Log
Every individual trade is listed — entry date, exit date, entry price, exit price, return, and exit reason (take-profit hit, stop-loss triggered, or signal exit). Use this to audit the strategy's behavior trade-by-trade.
Tip: Click Edit Strategy on any results page to reload that exact configuration into the Strategy Builder — tweak and re-run instantly.
Orbit AI
Orbit 2.0 is your AI-powered research terminal. It searches the web in real time, analyzes live market conditions, builds strategies from plain English, and explains backtest results with data-backed reasoning — like having a senior quant analyst available 24/7. Use the siderail for fast follow-ups on Home, Markets, and Builder, or open full Chat for deeper strategy work.
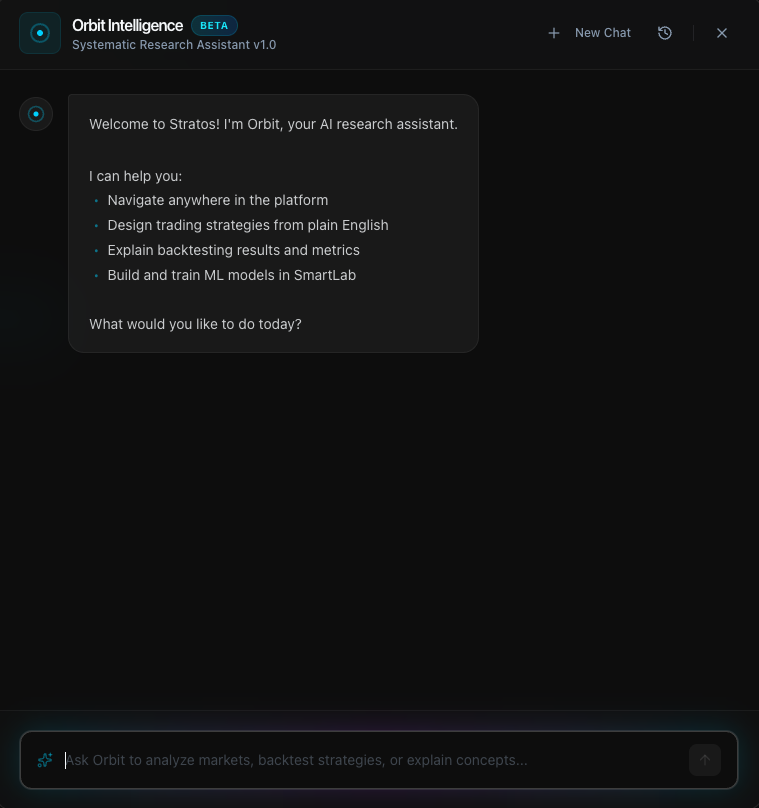
Core Capabilities
Real-Time Market Research
Ask about any ticker, sector, or macro trend. Orbit searches the web live, synthesizes multiple sources, and cites everything — so you can verify.
Strategy Generation
Describe a strategy in plain English. Orbit configures tickers, indicators, entry logic, and risk parameters, then populates the Strategy Builder automatically.
Backtest Analysis
After a backtest completes, ask Orbit to explain the results. It reads the actual metrics and gives specific, data-backed explanations — not generic advice.
Strategy Refinement
Tell Orbit what you want to change. It modifies only the relevant fields, explains its reasoning, and lets you iterate without starting over.
Quant Education
Ask anything about indicators, risk metrics, portfolio theory, or market mechanics. Orbit explains concepts clearly, with examples relevant to your strategy.
Transparent Reasoning
Orbit shows its thinking process in real time — which tools it's using, what it's searching for, and how it arrives at its answer. No black boxes.
How It Works
Thinking
When you ask a question, Orbit shows a live thinking indicator with the tools it's invoking (web search, backtest lookup, strategy analysis). You can see exactly what it's doing.
Sources
For research queries, Orbit cites its sources at the bottom of each response. Click any source to verify the information directly.
Actions
When Orbit builds or modifies a strategy, it generates action buttons (Backtest, View Results, Save) that let you act on its suggestions with a single click.
Memory
Orbit remembers context within a conversation session. You can iterate naturally —"now add a trailing stop"— without restating the full strategy each time.
Example Prompts
“What's happening with NVDA today? Any catalysts?”“What's the market sentiment on semiconductors right now?”“Build me a mean reversion strategy on QQQ that buys when RSI drops below 30 and sells when MACD crosses above the signal line.”“Create a trend-following strategy on NVDA using EMA crossover — go long when the 20 EMA crosses above the 50 EMA, with a 3% stop loss.”“Analyze my latest backtest — why was the Sharpe ratio low?”“Adjust the take profit to 8% and add a trailing stop that activates after a 5% gain.”“Build a momentum strategy that only enters if SPY is above its 200-day moving average — use SPY as a macro filter.”SmartLab — SmartTrade Models
SmartLab is Stratos' model workspace. Start with a SmartTrade Alpha Model: define the market inputs, forecast target, model core, and validation method, then send it to Builder so ATLAS can train and evaluate the learned signal during a backtest.
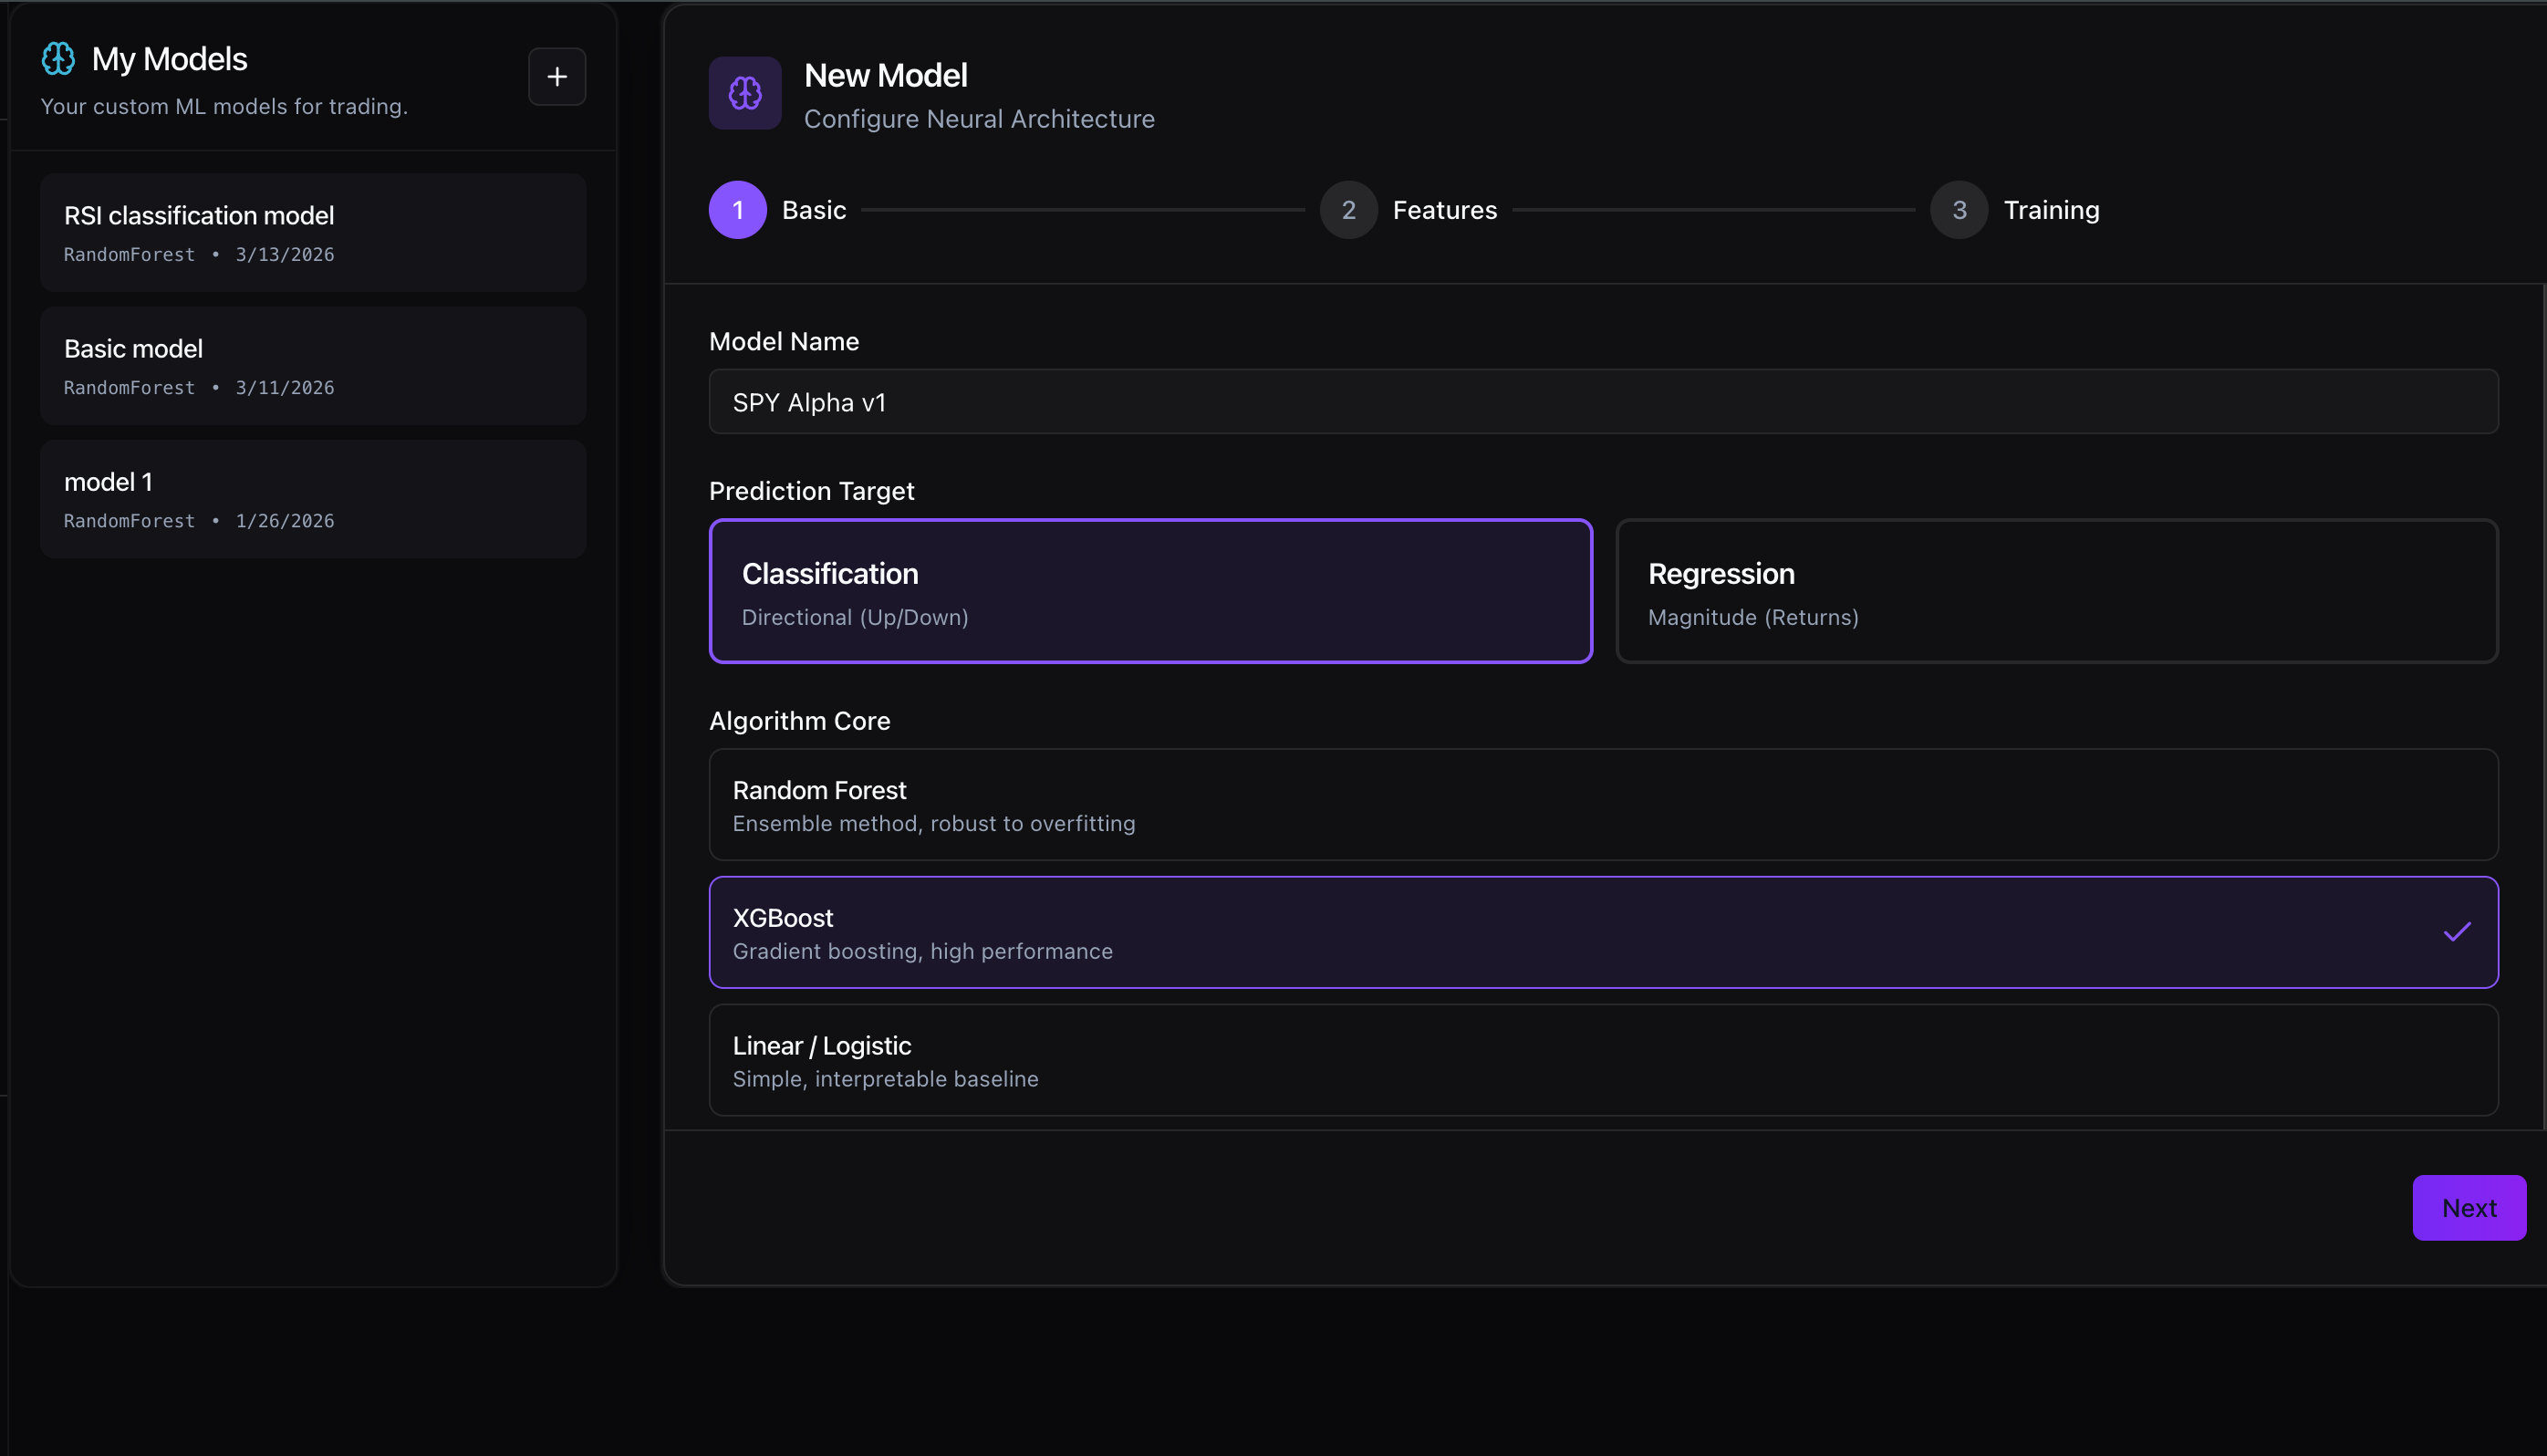
Create an Alpha Model
Go to SmartLab and click New Alpha Model. Give the model a name, choose a forecast target (Classification for Up/Down direction, Regression for return magnitude), and select a model core.
Define market inputs
Choose price action, trend, momentum, volatility, and volume inputs. Walk-forward validation is recommended because ATLAS trains on rolling windows during the backtest to reduce overfitting.
Send to Builder
In the Strategy Builder, set Entry Mode to SmartTrade and select your Alpha Model. ATLAS uses its predictions as the entry signal during backtesting.
Random Forest
Ensemble method, robust to overfitting. Good default choice.
XGBoost
Gradient boosting, high performance on structured data.
Linear / Logistic
Simple, interpretable baseline for directional prediction.
Backtest training vs live monitoring
ATLAS trains SmartTrade models inside Builder backtests. Live alerts and paper trading still use rule-based entry logic until EXO ML parity ships — so treat learned signals as research-grade today, not live auto-trade brains.
Tips & Best Practices
Start with Orbit, refine in the Builder
Let Orbit generate the initial strategy from a description, then open the Builder to manually fine-tune indicators, periods, and risk levels. This is the fastest iteration loop.
Test longer periods first
A 5–10 year backtest includes multiple market regimes (bull, bear, choppy). Strategies that only work in one regime are fragile. Strong systems survive 2020, 2022, and 2024.
Trust Monte Carlo over point-in-time returns
A 50% return on a single run could be a lucky sequence. If the Risk of Loss is above 25% or the 5th percentile is deeply negative, the edge is fragile regardless of the headline return.
Use supplementary tickers as macro filters
Add SPY or TLT as a supplementary ticker and reference them in your entry logic (e.g., only go long when Close > SPY_EMA_200). This is a classic regime filter that reduces drawdown in bear markets.
Account for indicator warmup when choosing periods
If you enable SMA(200) and test over 1 year of daily data (~252 bars), ATLAS removes the first 200 bars as warmup — leaving only ~52 bars for signal generation. Use longer test periods when using long-lookback indicators.
Size your stop loss to the timeframe
A 2% stop on a 1-minute chart will get hit by noise. A 1% stop on a daily chart may be too tight. ATR-based stops automatically scale to the asset's current volatility.
Use the Trade Log to audit signal quality
If most losses are stop-loss exits rather than signal exits, your stop is too tight. If you have very few trades over a long period, your entry conditions are too restrictive.
Alerts & Paper Trading
Stratos separates monitoring from execution so the workflow stays clear. Use /strategies to arm alerts and paper deployments. Use /home?tab=portfolio to monitor the paper account, open positions, and recent orders.
Live Alerts
Alerts monitor live market data and notify you when your strategy conditions trigger. Create them from Strategies → Alerts, from Builder deploy mode, or from a saved strategy detail page.
- Signals appear under Strategies → Alerts with ticker, timeframe, and active/paused state.
- Active alerts can be paused or deleted at any time.
- Alerts are notification-only. Use Strategies → Paper for automated paper orders.
Paper Trading
Paper trading uses a simulated account with virtual capital. Manual orders and strategy-triggered paper deployments flow into the Stratos paper ledger, where positions track live prices in real time. No real money is involved.
Portfolio Value
Total account equity — cash + open position market value.
Unrealized P&L
Aggregate profit or loss across all open positions, updated live.
Cash Available
Buying power remaining after open positions.
What's Coming Soon
Stratos is moving fast. These are the next product arcs that turn the research cockpit into a full strategy operating system.
News Feed & Market Sentiment
Coming SoonA Bloomberg-style stream of market-moving headlines — curated in real time from X, the web, and RSS — with sentiment tags and one-click Orbit follow-ups. Go from catalyst to thesis without leaving the terminal.
Scenario Analysis
Coming Soon"What happens to NVDA after it beats earnings while sentiment is positive?" — historical frequency, average return at 1d/5d/20d horizons, and the full distribution — so you pressure-test narratives with data, not vibes.
Advanced SmartTrade Models
PlannedNeural model cores, expanded forecast targets, and Conviction Filters on top of rule-based or Alpha Model signals — plus a path toward live ML monitoring once EXO parity ships.
Frequently Asked Questions
Where does your market data come from?
We source institutional-grade historical OHLCV data from Alpaca Markets. Minute and intraday data comes from their market data API; daily and weekly bars use adjusted prices to account for splits and dividends.
Does Stratos execute real trades or connect to my brokerage?
No. Paper trading simulates positions against live prices with virtual capital. Stratos does not place real-money orders at a brokerage. Alerts send a notification. They do not submit an order.
How accurate are the backtests?
A backtest is a historical simulation. ATLAS evaluates a signal on a closed bar and fills at the next bar open, so the fill does not use a price known only after that bar. Slippage and commission start at zero in Builder until you set them. Simulated results are not actual trading. The Terms of Service include the hypothetical-performance disclosure.
What can Orbit do? Can it see my data?
Orbit 2.0 can search the web for live market data, analyze your backtest results, build and modify strategies, and explain financial concepts. It can only read your strategies or backtests when you explicitly ask it to. We do not use your data to train shared models or share it with other users. Your alpha is yours.
What assets can I backtest?
During beta, Stratos supports US-listed equities and ETFs through Alpaca market data, plus major crypto pairs such as BTC/USD and ETH/USD. Unsupported symbols are rejected before they waste a run.
How far back does historical data go?
Daily equity history can go back up to roughly 10 years depending on the asset. Crypto coverage varies by pair and generally starts around 2020. Intraday history is shallower and may be tier-limited during beta.
Can I backtest multiple tickers at once?
Yes. Add multiple tickers to your asset universe and the ATLAS engine tests each one independently, then aggregates results. You can also add supplementary tickers (like SPY or VXX) as macro data inputs without trading them directly.
What programming knowledge do I need?
None required for the Builder or ML modes. Code mode uses a simple Python-style boolean expression syntax — no functions, imports, or classes. If you can write a spreadsheet formula, you can write entry logic in Code mode.
Still need help?
Our Discord community is the fastest way to get answers, discuss strategies, and report issues directly to the team.
Join our Discord